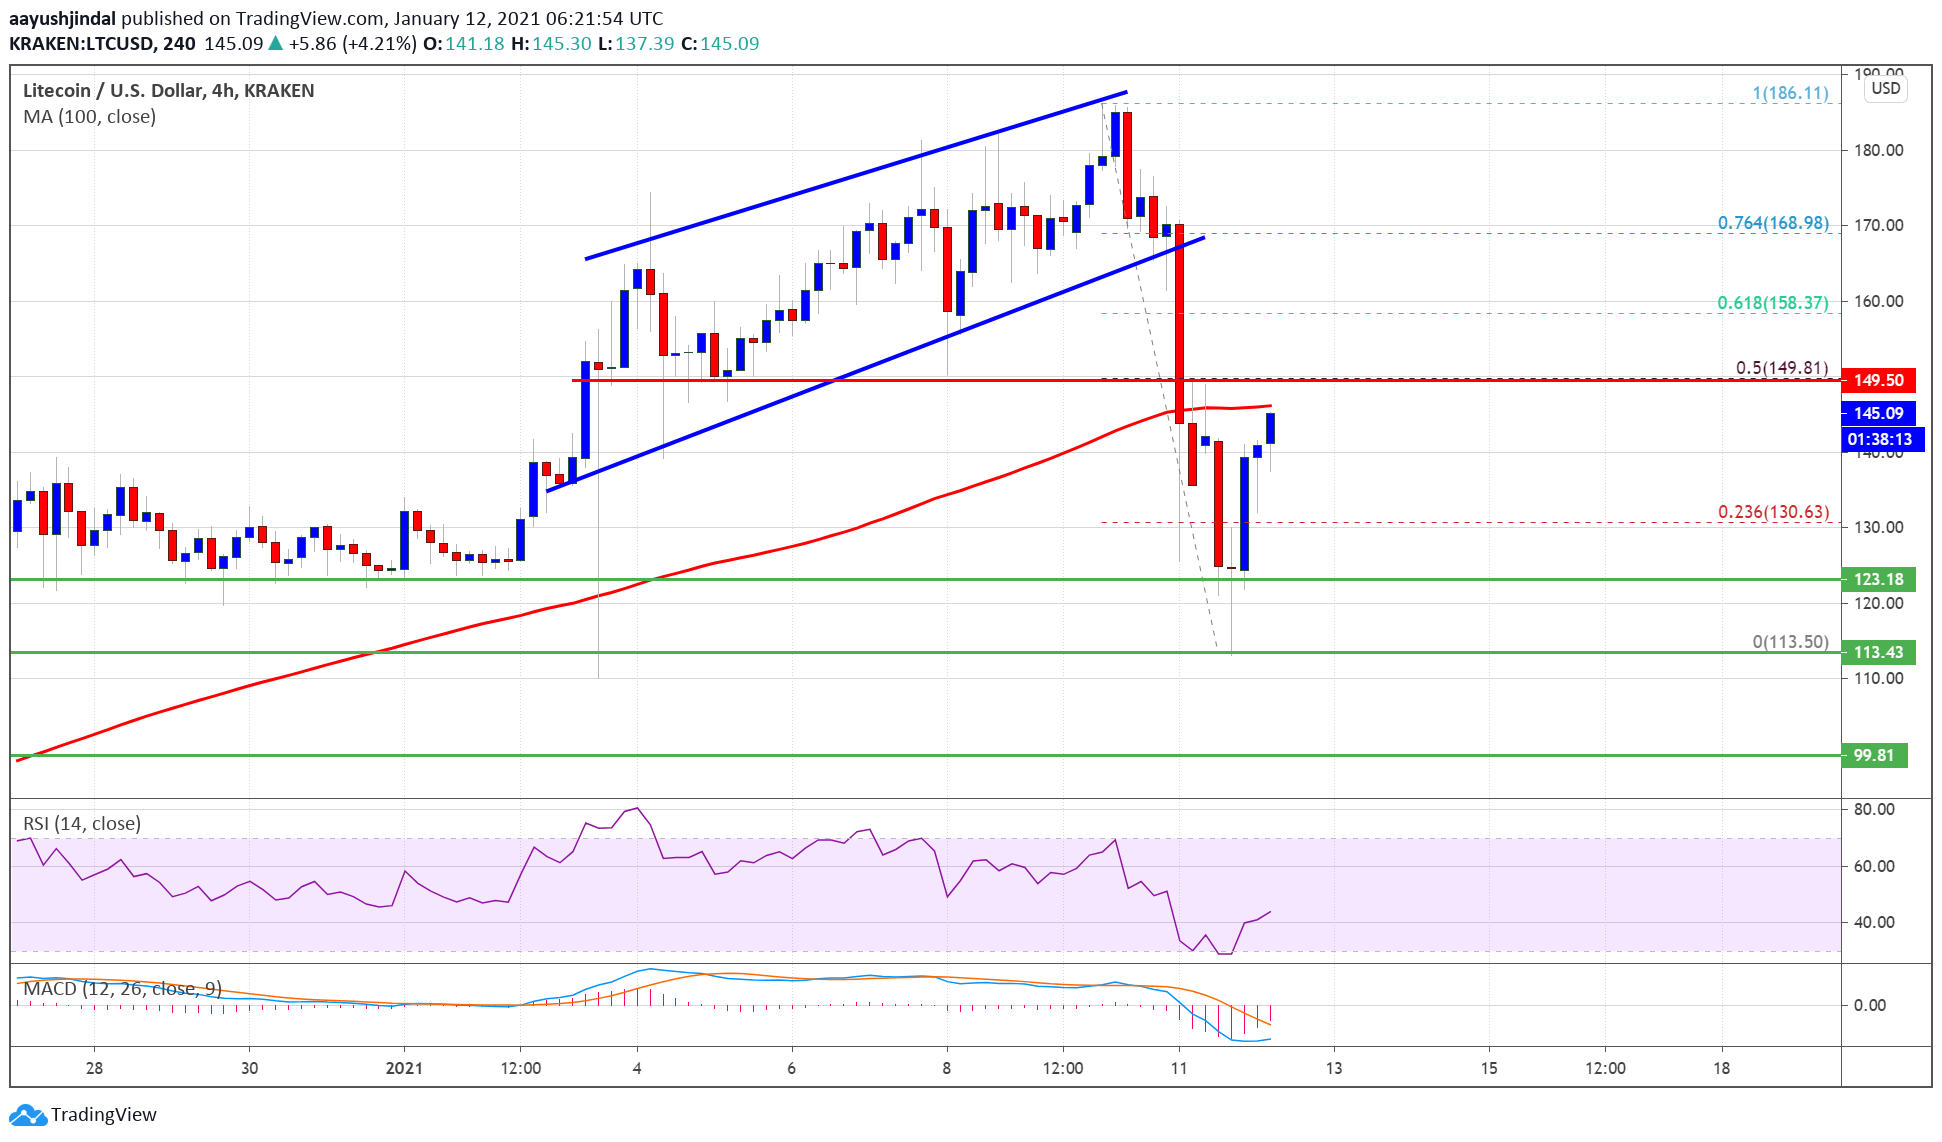
Litecoin price declined heavily below $150, but it found support near $115 against the US Dollar. LTC is currently rising, but it is likely to face a strong resistance near $150.
- Litecoin started a strong decline below the $165 and $150 support levels against the US Dollar.
- The price is rising from the $115 zone and it is testing the 100 simple moving average (4-hours).
- Earlier, there was a break below a key ascending channel with support at $165 on the 4-hours chart of the LTC/USD pair (data feed from Kraken).
- The price must clear the $150 resistance to move back into a positive zone.
Litecoin Price Recovers above $140
Recently, we saw a sharp decline in bitcoin, Ethereum, ripple and litecoin against the US Dollar. LTC price formed a short-term top near the $185 before starting the drop. It broke many important supports near $165 to move into a bearish zone.
There was also a break below a key ascending channel with support at $165 on the 4-hours chart of the LTC/USD pair. Litecoin price even broke the $150 support and the 100 simple moving average (4-hours).
There was a spike below the $125 support before the bulls showed near $115. A low is formed near the $113 level and the price is currently rising. There was a break above the $125 and $130 levels. The price recovered above the 23.6% Fib retracement level of the downward move from the $186 high to $113 low.
Source: LTCUSD on TradingView.com
It is now approaching the $150 resistance level and the 100 simple moving average (4-hours). The 50% Fib retracement level of the downward move from the $186 high to $113 low is also near $150 to act as a resistance.
If there is a clear break above the $150 resistance, the price could start a strong increase. In the stated case, the price is likely to continue higher towards the $165 and $170 levels.
Fresh Dip in LTC?
If Litecoin price fails to clear the $150 resistance level, there could be another pullback. An initial support on the downside is near the $135 level.
The first major support is forming near the $132 level. Any further losses may perhaps send the price towards the $124 support in the coming sessions.
Technical indicators:
4-hours MACD – The MACD is slowly moving into the bullish zone.
4-hours RSI (Relative Strength Index) – The RSI for LTC/USD is currently correcting higher towards 50.
Major Support Levels – $135 followed by $124.
Major Resistance Levels – $150 and $165.

